

PORTFOLIO
Real projects. Measurable results.
Examples of how I have taken raw datasets and transformed them into clear analysis outputs using Excel, SQL, Power BI and Tableau. These help the business track KPIs and understand business performance
Tableau
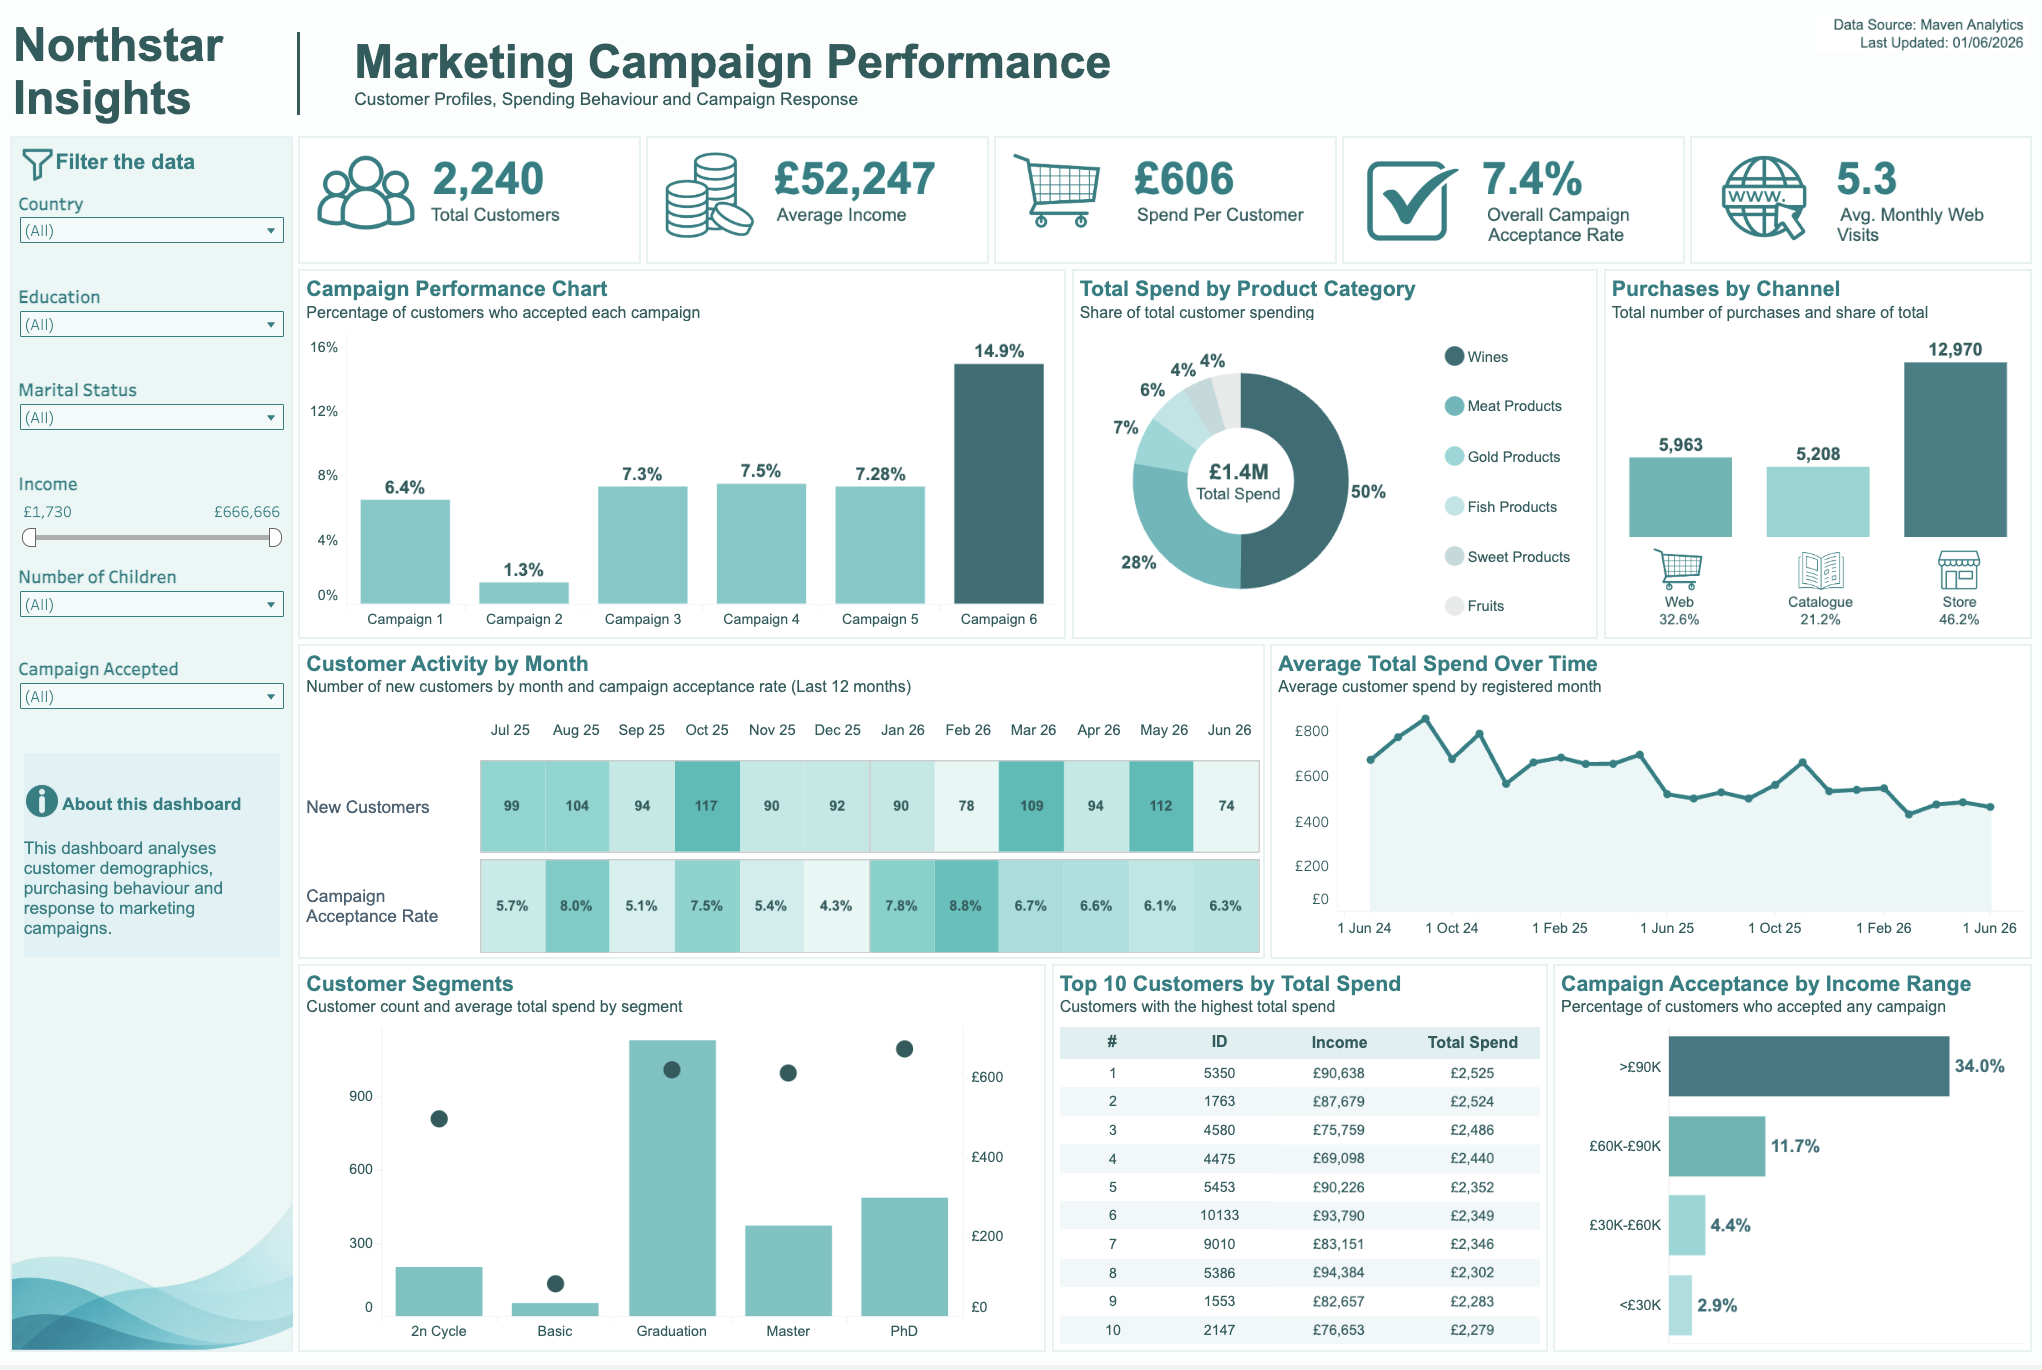
Marketing Campaign
Explored marketing campaign data to evaluate performance across different campaigns and channels. Created an interactive Tableau dashboard to compare results, identify trends and understand which activities delivered the strongest performance.
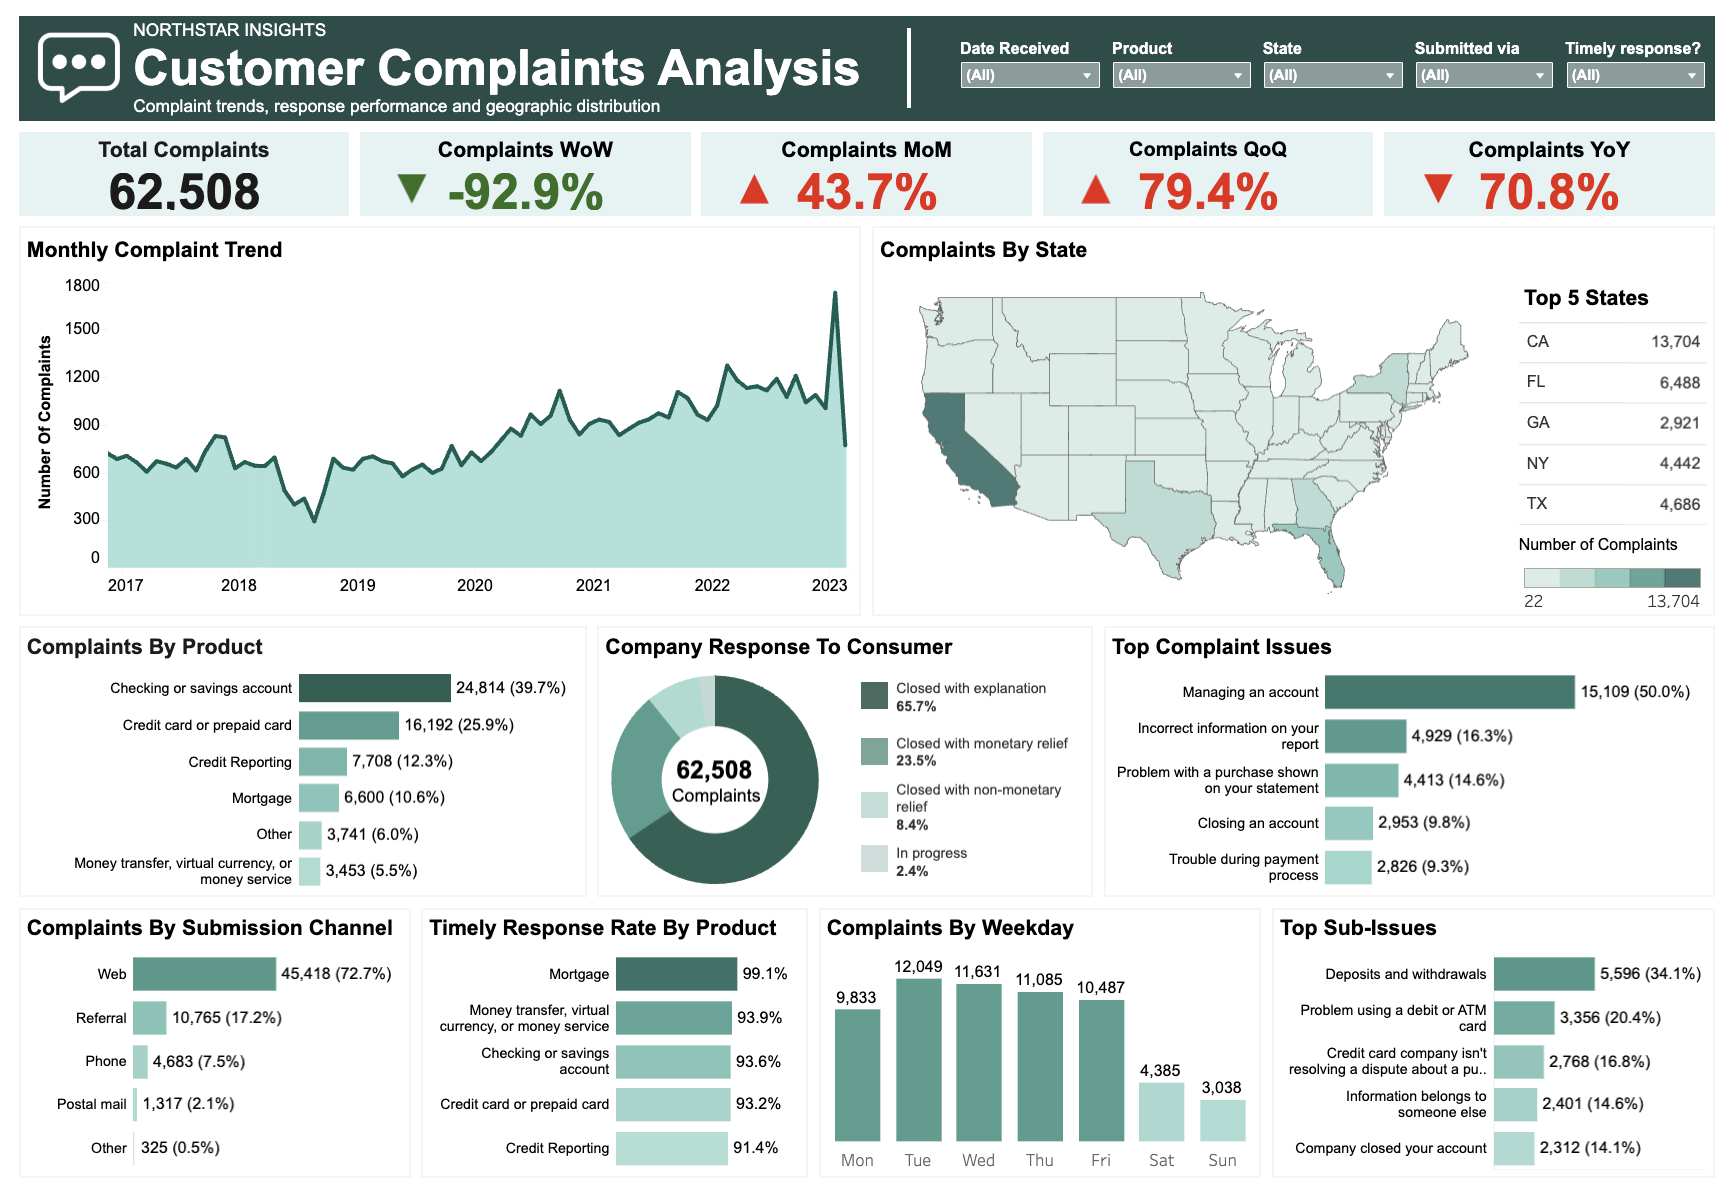
Customer Complaints Analysis
Analysed customer complaints data to identify recurring issues, emerging trends and areas of concern. Developed a Tableau dashboard to visualise complaint patterns and help highlight opportunities to improve customer experience.
Excel
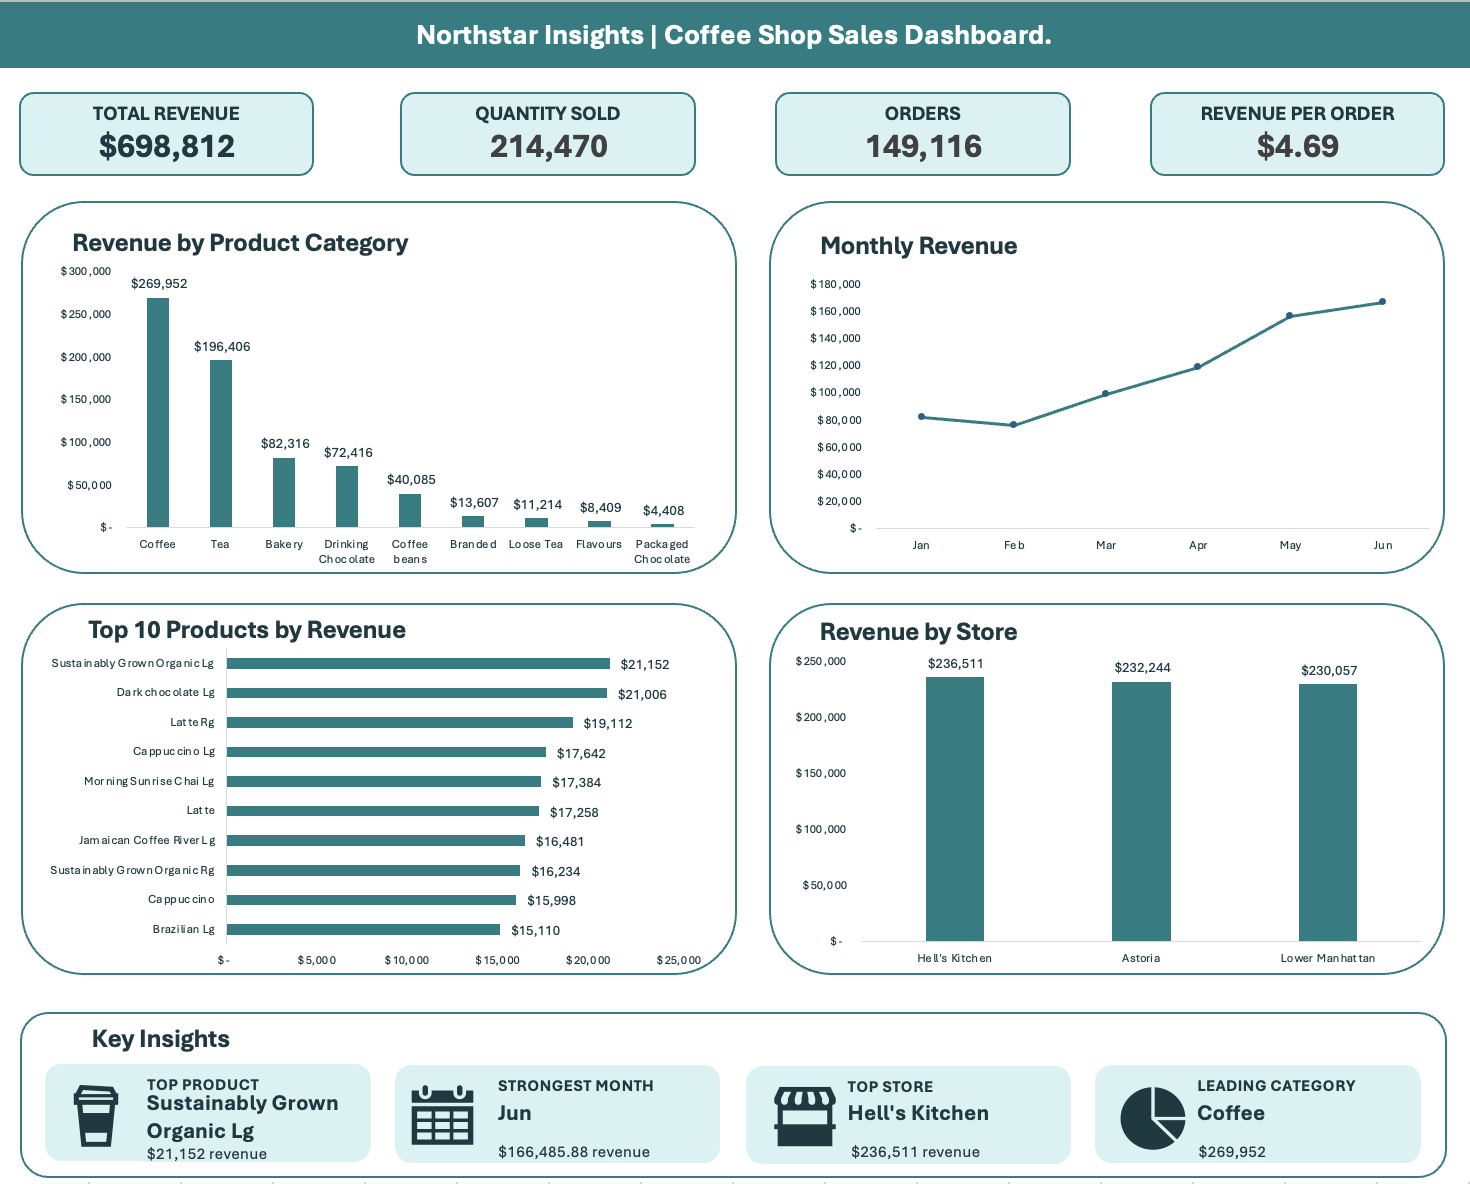
Coffee Shop Sales
For a simpler desired output. Worked with coffee shop sales data, analysing revenue, product performance and customer purchasing patterns. Used Excel to explore trends, calculate key performance metrics and create an interactive dashboard to present the findings.
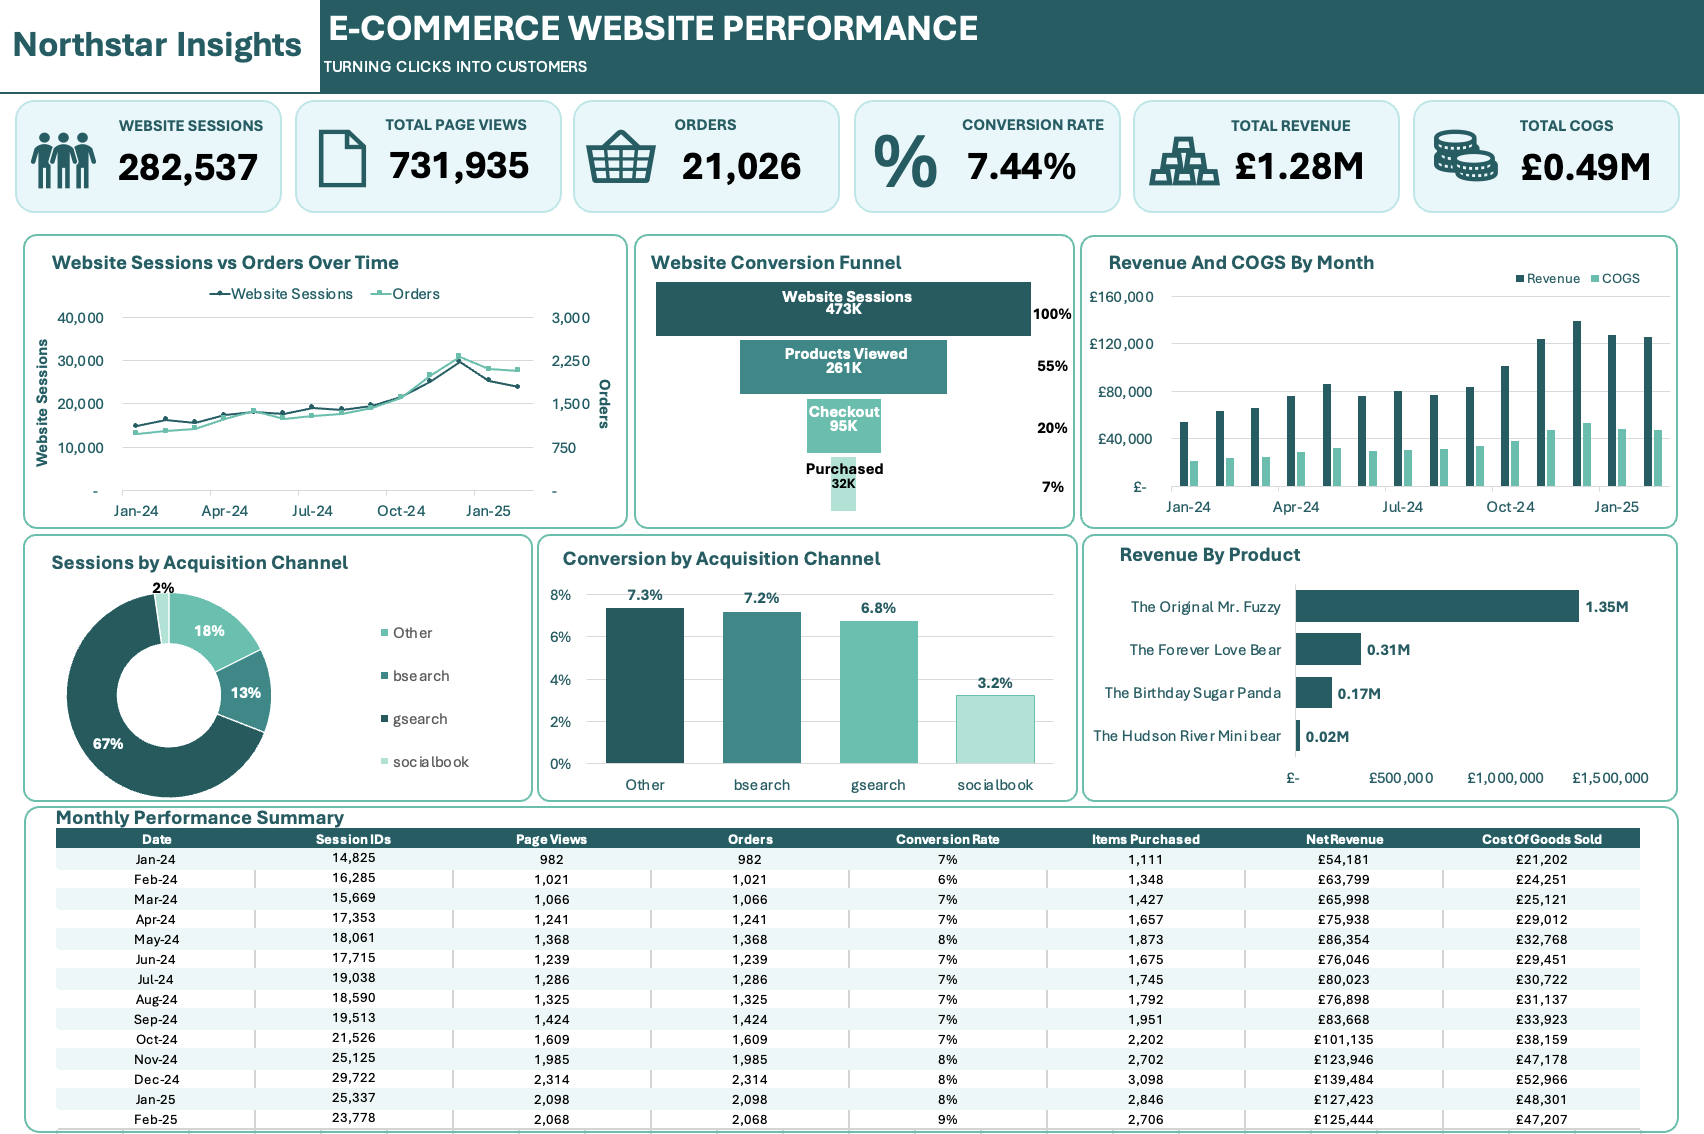
Customer Complaints Analysis
Used SQL to query and analyse e-commerce data, exploring sales performance, customer behaviour and purchasing trends. Exported and organised the findings in Excel to develop clear reporting and highlight key business insights.